The goal of this project will be a sales prediction for food items sold at various stores.
Author: Derek Overton
The goal of this is to help the retailer understand the properties of products and outlets that play crucial roles in increasing sales. Build several data visualizations to help your stakeholders better understand trends in the data.
Link to the Data Set. https://drive.google.com/file/d/1syH81TVrbBsdymLT_jl2JIf6IjPXtSQw/view
Before splitting your data, we check for duplicates. We then dropped any duplicates found and fix inconsistencies in categorical data. Identify the features (X) and target (y): Assign the "Item_Outlet_Sales" column as your target and the rest of the relevant variables as your features matrix. Perform a train test split Create a preprocessing object to prepare the dataset for Machine Learning Make sure your imputation of missing values occurs after the train test split using SimpleImputer.
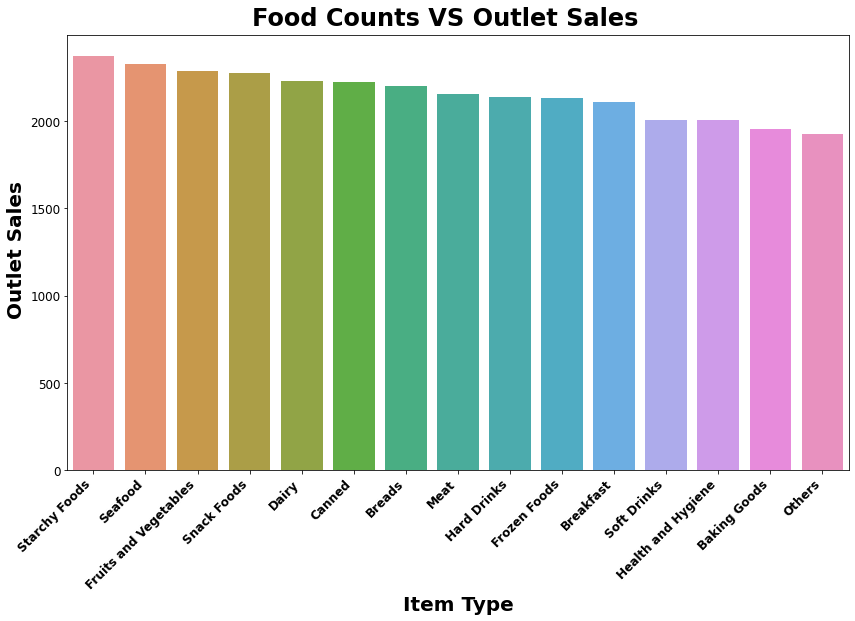
- Base on the data we see that Starchy Foods has the higest sales count.
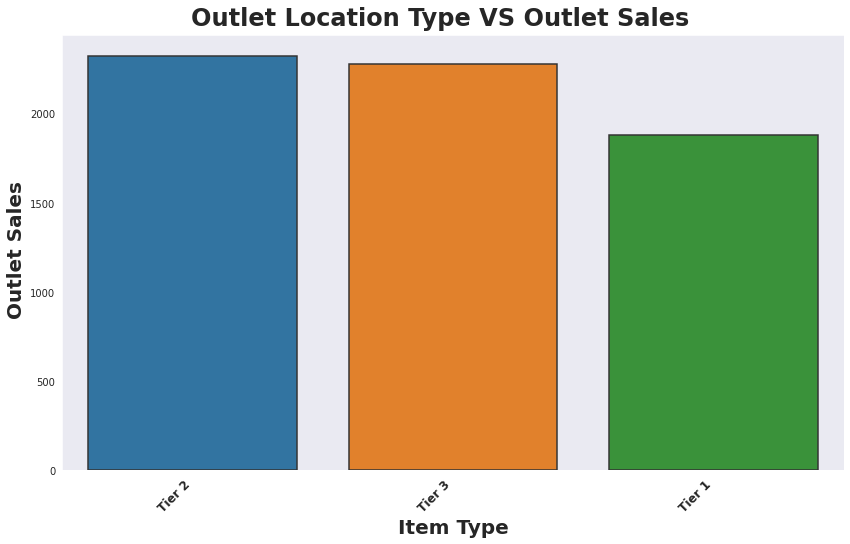
- Base on data Tier 2 Location has greater Outlet Sales that Teir 1.
Used a Random Forest Regressor Model as our final model. Here, we saw the best results as far as the regression metrics and the model's performance. This model still has some bias. However, this model has the best performance on the testing set. For the R^2 score 60.4% of the variance is explained. For the MAE the testing score is off by about 728.039
Overall, the best model is definitely the tuned Random Forest Regressor Model. There was still some bias in the model, but by far it outperformed the linear regression model.
It is important to know what you Best Max Depth is along with your Best Estimators are. Based on this model the best Max depth is 5 and the Best Estimator is 92.
No Limitations were noted throughtout this project.
For any additional questions, contact Email: Talented225@gmail.com