This document outlines the steps necessary to generate Kevin L. Turner's data and code contributions to the Soot manuscript Intranasal Administration of Functionalized Soot Particles Disrupts Olfactory Sensory Neuron Progenitor Cells in the Neuroepithelium by Jordan N. Norwood, Akshay P. Gharpure, Kevin L. Turner, Lauren Ferrer-Pistone, Randy Vander Wal, and Patrick J. Drew.
This data and code generates Figure 3 of the manuscript.
Begin by downloading the entire code repository and (if desired) the data from the following locations:
- Code repository location: https://github.com/DrewLab/Norwood_Gharpure_Turner_Ferrer-Pistone_VanderWal_Drew_Manuscript2020
- Data repository location: https://psu.box.com/s/h6fbdosivsbbn3mm26rcf7s4wy37eifr
The github repository contains a pre-analyzed AnalysisResults.mat structure that can be used to immediately generate the figures without re-analyzing any data. If you would like to view the figure in its final form, simply CD to the code repository's directory (folder) in Matlab and open the file MainScript_JK2020.m. This file will add all the requisite sub-functions and generate the figure. If you would like to re-analyze the data from the beginning, download each animal's folder (26 total) from the box link. Unzip all 26 folders and put them into the same folder that contains the code repository (Norwood_Gharpure_Turner_Ferrer-Pistone_VanderWal_Drew_Manuscript2020). Remove or delete the AnalysisResults.mat structure from this folder, as the code will only run from the beginning if this file is not present. If done correctly, two loading bars should pop up upon execution of MainScript_JK2020.m. This will take a while to run, depending on computer speed and data location.
The data provided has gone through several pre-processing steps. Original data is available upon request. The code used to acquire the data and process all initial files is provided in the code repository's RealSenseD435-Camera-Streaming and RealSenseD435-Data-Analysis folders, respectively.
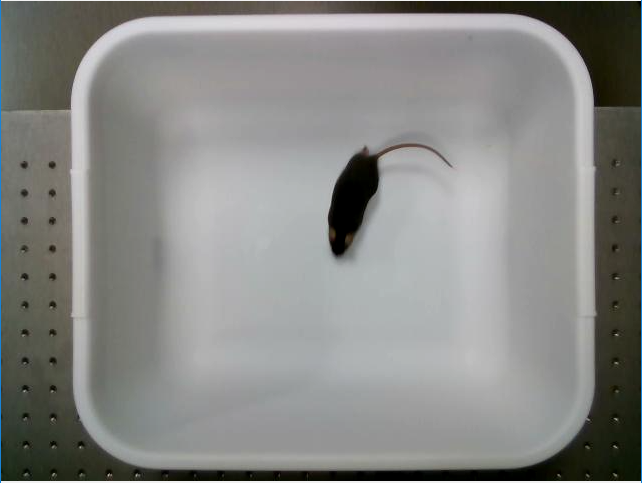
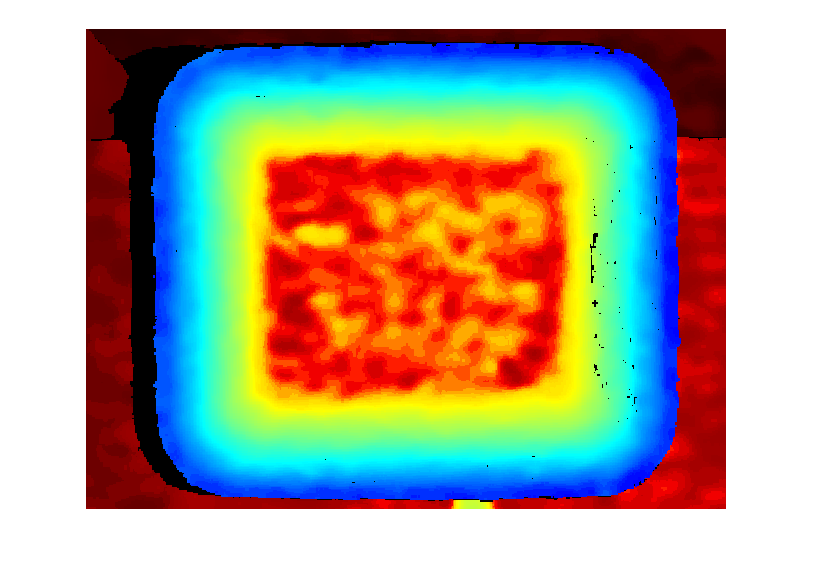
Data is acquired from a RealSense D435 camera (see: https://github.com/IntelRealSense and https://github.com/IntelRealSense/librealsense) using a Matlab wrapper. The camera stream provided a nominal sampling rate of 15 Hz and has an RGB image stream and infrared (IR) based depth stream. The camera was aligned with the container (Fig.A) and an example of an auto-generated pseudo-depth stream is shown in Fig.B. I refer to this stream as pseudo-depth because the colorization map is relative to the topography of the landscape and tries to emphasize contrast. It also updates in real-time based on the min/max depth of the landscape. If you move your hand into the image stream, you'll notice the entire color map adjusts to emphasize the new peaks/valleys. This image stream therefore contains no useful information, and is not saved. The true-depth from the camera can be pulled from the infrared image pipeline via the Matlab wrapper.
| [A] Verify camera alignment | [B] Live pseudo-depth stream |
|---|---|
 |
 |
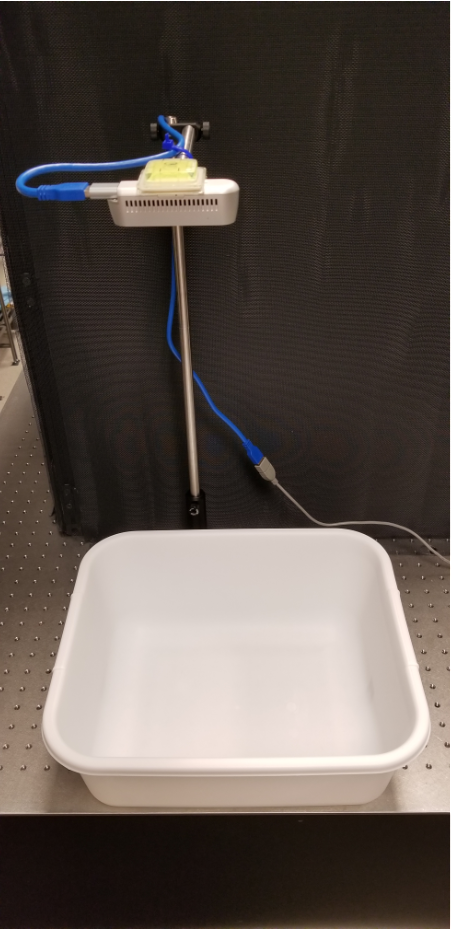
I chose a smooth-bottom, opaque plastic container that is slightly larger than the mouse's home cage. The mouse's cage, which has yellow-tinted transparent walls, creates a mirror reflection of the mouse that distorts the IR stream as the mouse approaches the wall. This causes significant issues when trying to background-subract the frames and track the moving target (mouse). An opaque, not-reflective container such as these plastic bins work well to reduce this noise and distortion of the IR signal. They are also sufficiently tall that the mouse cannot climb out, provide a smooth depth across the top/sides that doesn't change or reflect the mouse's image, and are easy to clean with ethanol or bleach between animals. I recommend having several of them so that they can dry after being cleaned/thoroughly rinsed with water between experiments.
| [C] | [D] |
|---|---|
 |
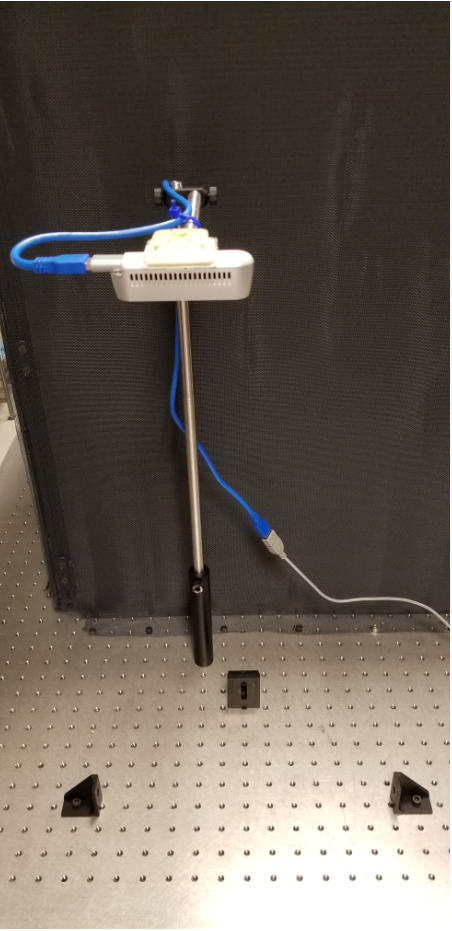 |
The camera is located directly above the bin (Fig.C) at a constant height (note the bubble-level) and the bin is easily-aligned between animals with pre-positioned angle brackets (Fig.D).
| [E] Initial background removal | [F] Aggressive removal | [G] Colormap adjustment |
|---|---|---|
 |
 |
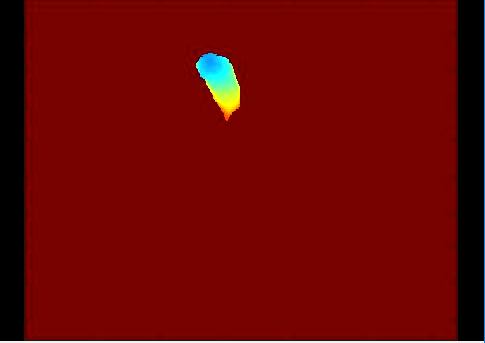 |
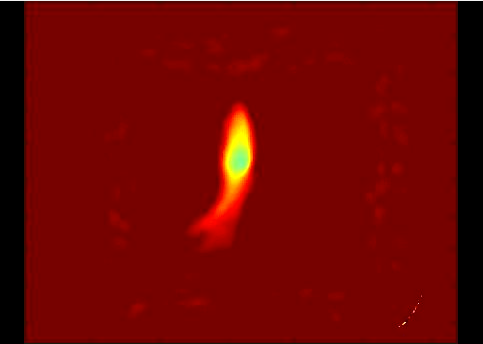
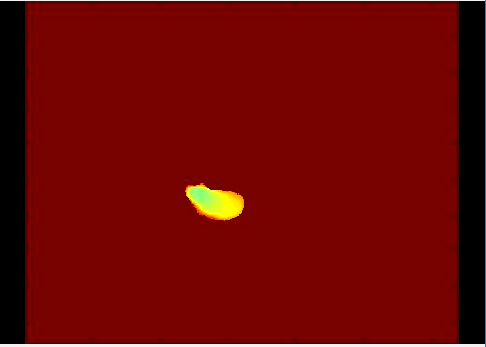
Example images during various stages of image processing are shown in Fig.E-G. Supplemental movies are available on Box folder in the folder Video Examples that show original side-by-side comparisons of the RGB stream and the depth-stream both before (Supplemental_Movie_1.avi) and after (Supplemental_Movie_2.avi) image processing.
Rearing events were defined as when the mean of the highest 20% of pixels of the mouse were 8 cm from the bottom of the bin enclosure. These events were tracked across the 20 minute imaging duration and averaged across the different treatment conditions. Rearing events were counted as 1 event when the mouse stood up (crossing the 8 cm threshold) and then went back down. Subsequently, the duration of each rearing event was estimated as the number of samples (1/15 sec) occuring between crossing above/returning below the 8 cm threshold.
To track the distance the animal traveled, the distance between the centroid of the mouse was calculated between each successive frame then summed over the course of the 20 minutes. For an example showing on-going tracking of both distance and rearing behavior, see Supplemental_Movie_3 in the Video Examples folder on Box.
Notes on each animal including soot treatment information, sex, and birth dates can be found in SootExperimentDataSheet.xlsx.
- Intel RealSense SDK and Matlab wrapper https://github.com/IntelRealSense/librealsense
- Kalman_Stack_Filter.m Author: Rob Campbell https://www.mathworks.com/matlabcentral/fileexchange/26334-kalman-filter-for-noisy-movies
- multiWaitbar.m Author: Ben Tordoff https://www.mathworks.com/matlabcentral/fileexchange/26589-multiwaitbar-label-varargin
- colors.m Author: John Kitchin http://matlab.cheme.cmu.edu/cmu-matlab-package.html