
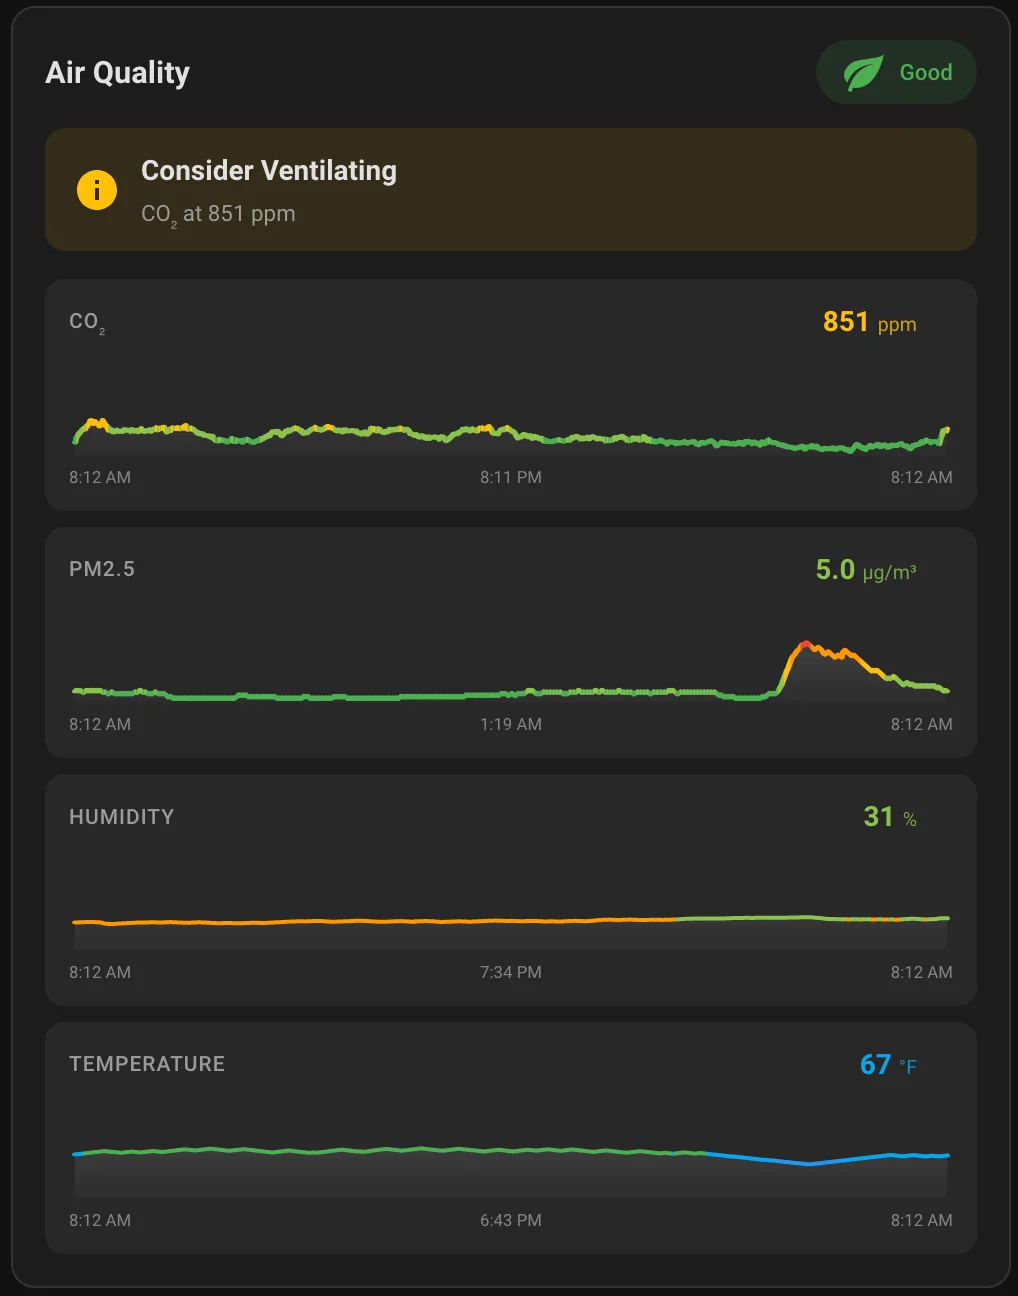
A custom Home Assistant Lovelace card for monitoring indoor air quality with beautiful gradient graphs and WHO-based health thresholds.
- Features
- Installation
- Configuration
- Built-in Recommendations
- Health Thresholds
- Supported Devices
- Development
- Other Cards
- Star History
- Support
- Real-time monitoring of CO, Radon, CO2, PM2.5, PM10, PM1, PM0.3, HCHO, tVOC, NOx, O2, NO2, O3, Propane, humidity, temperature, atmospheric pressure, and noise
- CO, Propane, and low-O2 safety alerts -- critical red warnings for dangerous carbon monoxide, gas leak, or oxygen-deficient levels
- Radon advisory banner -- separate long-term health advisory with EPA/WHO thresholds (supports pCi/L and Bq/m3)
- Gradient-colored graphs that change color based on air quality levels
- Interactive hover/touch to see historical values at any point
- Health-based thresholds following WHO 2021 guidelines and ASHRAE standards
- Actionable recommendations like "Open Window" or "Run Air Purifier"
- Outdoor sensor comparison - optional dashed line overlay with smart ventilation recommendations
- Tap to expand - click any graph to open the full Home Assistant history view
- Visual configuration editor - no YAML required, with collapsible sections for clean organization

Or manually: open HACS, search for "Air Quality Card", click Install, and refresh your browser.
- Download
air-quality-card.jsfrom the latest release - Copy it to
/config/www/air-quality-card/air-quality-card.js - Add the resource in Home Assistant:
- Go to Settings → Dashboards → Resources
- Add
/local/air-quality-card/air-quality-card.jsas a JavaScript Module
- Add a new card to your dashboard
- Search for "Air Quality Card"
- Configure the entities using the visual editor
- Primary sensors (CO₂, PM2.5, Humidity, Temperature) are always visible
- Expand "Additional Sensors" for Radon, CO, HCHO, tVOC, PM1, PM10, PM0.3, O2, NO2, O3, Propane, Pressure, Noise
- Expand "Outdoor Sensors" for comparison data
type: custom:air-quality-card
name: Office Air Quality
co2_entity: sensor.air_quality_co2
pm25_entity: sensor.air_quality_pm25
pm10_entity: sensor.air_quality_pm10
co_entity: sensor.air_quality_co
radon_entity: sensor.wave_1_day_average
radon_longterm_entity: sensor.wave_longterm_average
humidity_entity: sensor.air_quality_humidity
temperature_entity: sensor.air_quality_temperature
air_quality_entity: sensor.air_quality_index
hours_to_show: 24
temperature_unit: C
outdoor_co2_entity: sensor.outdoor_co2
outdoor_pm25_entity: sensor.outdoor_pm25| Option | Type | Required | Default | Description |
|---|---|---|---|---|
name |
string | No | "Air Quality" | Card title |
co2_entity |
string | No* | - | CO2 sensor entity ID |
pm25_entity |
string | No* | - | PM2.5 sensor entity ID |
pm1_entity |
string | No* | - | PM1 sensor entity ID |
pm10_entity |
string | No* | - | PM10 sensor entity ID |
pm03_entity |
string | No* | - | PM0.3 particle count sensor entity ID |
co_entity |
string | No* | - | Carbon monoxide (CO) sensor entity ID |
radon_entity |
string | No* | - | Radon sensor entity ID (supports pCi/L and Bq/m3) |
radon_longterm_entity |
string | No | - | Radon long-term average sensor (shown as dashed overlay on radon graph) |
hcho_entity |
string | No* | - | Formaldehyde (HCHO) sensor entity ID |
tvoc_entity |
string | No* | - | Volatile organic compounds (tVOC) sensor entity ID (absolute ppb or Sensirion VOC Index — auto-detected, see tvoc_unit) |
nox_entity |
string | No* | - | NOx sensor entity ID (absolute ppb or Sensirion NOx Index — auto-detected, see nox_unit) |
pm4_entity |
string | No* | - | PM4 sensor entity ID |
o2_entity |
string | No* | - | Oxygen (O2) sensor entity ID (%vol) |
no2_entity |
string | No* | - | Nitrogen Dioxide (NO2) sensor entity ID (µg/m³) |
o3_entity |
string | No* | - | Ozone (O3) sensor entity ID (µg/m³) |
c3h8_entity |
string | No* | - | Propane (C3H8) sensor entity ID (%vol — combustible-gas leak detection, e.g. air-Q's optional propane sensor) |
humidity_entity |
string | No* | - | Humidity sensor entity ID |
temperature_entity |
string | No* | - | Temperature sensor entity ID |
pressure_entity |
string | No* | - | Atmospheric pressure sensor entity ID (e.g. Airthings) |
noise_entity |
string | No* | - | Noise / sound level sensor entity ID (dB) |
air_quality_entity |
string | No | - | Overall air quality index entity (passthrough — see below) |
hours_to_show |
number | No | 24 | Hours of history to display (1-168) |
temperature_unit |
string | No | "auto" | Temperature unit: "auto" (detect from HA), "F" (Fahrenheit), or "C" (Celsius) |
temperature_decimals |
boolean | No | false |
Show the temperature reading with one decimal place (e.g. 21.4°) instead of rounding to a whole number. Applies to the indoor value, the outdoor (out: …) suffix, and the graph tooltip |
radon_unit |
string | No | "auto" | Radon unit: "auto" (detect from sensor), "pCi/L" (US), or "Bq/m3" (International) |
tvoc_unit |
string | No | "auto" | tVOC measurement type: "auto" (detect from sensor), "ppb" (absolute), or "index" (Sensirion VOC Index) |
nox_unit |
string | No | "auto" | NOx measurement type: "auto" (detect from sensor), "ppb" (absolute), or "index" (Sensirion NOx Index) |
show_min_max |
boolean | No | false |
Overlay the min/max values of the displayed time window directly at the data points on the graph |
y_scale |
string | No | "fixed" | "fixed" anchors each graph to the metric's full meaningful range; "auto" zooms the Y-axis to the data (with 10% headroom) so small variations are visible |
show_status_banner |
boolean | No | true |
Show or hide the recommendation banner (the "All Good / Ventilate Now / …" strip at the top of the card) |
order |
array | No | default | Custom display order for metrics (see Sensor Order) |
display |
string | No | "full" | "full" (graphs and details), "compact" (status badge only), or "expandable" (compact, tap to expand to full) |
compact_alerts |
boolean | No | true |
In the compact/collapsed view, show small colored chips naming the sensors currently out of range |
auto_expand |
boolean | No | false |
With display: expandable, expand automatically while any sensor is out of range and collapse once readings have stayed normal for 5 minutes. A manual tap takes over until the card is re-created (page reload or dashboard edit) |
tap_action |
action | No | - | Standard HA action object (e.g., { action: navigate, navigation_path: /air-quality }). Active in compact mode |
hold_action |
action | No | - | Same as tap_action but fired after holding for ~500 ms |
double_tap_action |
action | No | - | Same as tap_action but fired on double-tap |
recommendation_action |
action | No | - | Standard HA action surfaced as a one-tap button on the recommendation strip (e.g. toggle a purifier/fan, or run a script). Shown only when there's an actionable recommendation |
co_thresholds |
array | No | [4, 9, 35, 100] |
Custom CO color/status thresholds (4 ascending numbers defining 5 tiers) |
co2_thresholds |
array | No | [600, 800, 1000, 1500] |
Custom CO₂ color/status thresholds |
pm25_thresholds |
array | No | [5, 15, 25, 35] |
Custom PM2.5 thresholds |
pm10_thresholds |
array | No | [15, 45, 75, 150] |
Custom PM10 thresholds |
pm1_thresholds |
array | No | [5, 15, 25, 35] |
Custom PM1 thresholds |
pm03_thresholds |
array | No | [500, 1000, 3000, 5000] |
Custom PM0.3 thresholds |
pm4_thresholds |
array | No | [10, 25, 37.5, 50] |
Custom PM4 thresholds |
hcho_thresholds |
array | No | [20, 50, 100, 200] |
Custom HCHO thresholds (ppb) |
tvoc_thresholds |
array | No | mode-dependent | Custom tVOC thresholds (units depend on tvoc_unit) |
nox_thresholds |
array | No | mode-dependent | Custom NOx thresholds (units depend on nox_unit; defaults [20, 53, 100, 360] ppb / [5, 20, 150, 300] index) |
o2_thresholds |
array | No | [16, 19.5, 23.5, 25] |
Custom O2 thresholds (%vol) |
no2_thresholds |
array | No | [10, 25, 40, 200] |
Custom NO2 thresholds (µg/m³) |
o3_thresholds |
array | No | [60, 100, 180, 240] |
Custom O3 thresholds (µg/m³) |
c3h8_thresholds |
array | No | [0.05, 0.21, 0.42, 1.05] |
Custom Propane thresholds (%vol) |
radon_thresholds |
array | No | [48, 100, 148, 300] |
Custom radon thresholds (Bq/m³ — even if you display in pCi/L) |
humidity_thresholds |
array | No | [30, 40, 50, 60] |
Custom humidity thresholds (%) |
pressure_thresholds |
array | No | [990, 1005, 1025, 1040] |
Custom atmospheric pressure thresholds (hPa by default; override for inHg/mmHg) |
noise_thresholds |
array | No | [35, 45, 55, 70] |
Custom noise thresholds (dB) |
air_quality_thresholds |
array | No | - | Interpret a numeric air_quality_entity through 5 tiers (Excellent/Good/Fair/Poor/Very Poor) instead of showing the raw number (see below) |
outdoor_pressure_entity |
string | No | - | Outdoor atmospheric pressure sensor for comparison |
temperature_thresholds |
array | No | unit-dependent | Custom temperature thresholds (in the unit your sensor reports) |
language |
string | No | "auto" | UI language. "auto" (use Home Assistant's), "en", "es", "fr", "de", "pt", "hu", or "pl" |
outdoor_co2_entity |
string | No | - | Outdoor CO2 sensor for comparison |
outdoor_pm25_entity |
string | No | - | Outdoor PM2.5 sensor for comparison |
outdoor_pm1_entity |
string | No | - | Outdoor PM1 sensor for comparison |
outdoor_pm10_entity |
string | No | - | Outdoor PM10 sensor for comparison |
outdoor_pm03_entity |
string | No | - | Outdoor PM0.3 sensor for comparison |
outdoor_co_entity |
string | No | - | Outdoor CO sensor for comparison |
outdoor_hcho_entity |
string | No | - | Outdoor HCHO sensor for comparison |
outdoor_tvoc_entity |
string | No | - | Outdoor tVOC sensor for comparison |
outdoor_nox_entity |
string | No | - | Outdoor NOx sensor for comparison |
outdoor_no2_entity |
string | No | - | Outdoor NO2 sensor for comparison |
outdoor_o3_entity |
string | No | - | Outdoor O3 sensor for comparison |
outdoor_humidity_entity |
string | No | - | Outdoor humidity sensor for comparison |
outdoor_temperature_entity |
string | No | - | Outdoor temperature sensor for comparison |
* At least one sensor entity is required. Use any combination that fits your setup.
The optional air_quality_entity is a passthrough: whatever value the entity reports is shown directly on the status badge (lowercased and mapped to a color based on standard HA AQI states — good / moderate / fair / poor / very_poor / extremely_poor). The card doesn't interpret it as indoor or outdoor — use whichever entity fits your dashboard.
If your index entity reports a number instead of a status word (e.g. Netatmo's Healthy Home Coach health index, where 0 = healthy and 4 = unhealthy), add air_quality_thresholds — four ascending boundaries mapping the number onto Excellent / Good / Fair / Poor / Very Poor:
type: custom:air-quality-card
air_quality_entity: sensor.healthy_home_coach_air_quality
air_quality_thresholds: [1, 2, 3, 4]  # Netatmo health index: 0=Excellent … 4=Very Poor
If you leave it unset, the card computes the status itself from your configured CO / CO₂ / PM2.5 / radon sensors (CO and radon are prioritized as life-safety/health concerns).
Customize which sensors come first on the card. In the visual editor, use the multi-select to tick metrics in the order you want them shown. In YAML, provide a list of metric names. Any metric you don't list keeps its default position and stays visible.
Valid metric names: co, c3h8, o2, radon, co2, pm25, pm10, pm1, pm03, pm4, hcho, tvoc, nox, no2, o3, noise, humidity, temperature, pressure.
type: custom:air-quality-card
co2_entity: sensor.air_quality_co2
humidity_entity: sensor.air_quality_humidity
temperature_entity: sensor.air_quality_temp
pm10_entity: sensor.air_quality_pm10
pm25_entity: sensor.air_quality_pm25
order:
  - temperature
  - humidity
  - co2
  - pm10
- pm25Surface a one-tap button on the recommendation strip to act on what the card suggests — e.g. turn on an air purifier when it recommends "Run Air Purifier", or run a script. Uses Home Assistant's standard action format, so it supports perform-action, toggle, navigate, url, more-info, etc. The button appears only when there's an actionable recommendation (hidden when air quality is "All Good").
type: custom:air-quality-card
co2_entity: sensor.air_quality_co2
pm25_entity: sensor.air_quality_pm25
recommendation_action:
  action: perform-action
  perform_action: homeassistant.toggle
  target:
    entity_id: fan.air_purifier
For per-recommendation routing (different action depending on whether it's a purifier vs. ventilation suggestion), point this at a script that branches on your sensor states.
For overview dashboards where you want a small "go to the air quality page" indicator, use display: compact. Renders just the title and the overall status badge, with optional HA tap actions.
When any sensor reads outside its normal range, small colored alert chips appear next to the badge naming the offenders (most severe first — CO and radon always lead — capped at 4 plus a +N overflow pill) — so a yellow badge tells you what is off without expanding. Set compact_alerts: false to turn the chips off. Atmospheric pressure never produces a chip or triggers auto-expand: it's informational, not an air-quality hazard.
type: custom:air-quality-card
name: Air Quality
co2_entity: sensor.air_quality_co2
pm25_entity: sensor.air_quality_pm25
display: compact
tap_action:
  action: navigate
  navigation_path: /lovelace/air-quality
Compact mode:
- Skips the history fetch (faster initial load)
- Status badge updates in real-time from current sensor values
- All three standard HA actions are supported:
tap_action,hold_action,double_tap_action
display: expandable starts as a compact summary and expands to the full card (graphs and details) when tapped — best of both worlds for space-constrained dashboards. A chevron indicates the toggle; tap the header again to collapse. History is fetched lazily the first time you expand.
type: custom:air-quality-card
name: Air Quality
co2_entity: sensor.air_quality_co2
pm25_entity: sensor.air_quality_pm25
display: expandable
In expandable mode the tap gesture is reserved for expand/collapse, so tap_action is ignored.
If your layout gives the card a fixed height (e.g. a sections view where the card was resized, which sets grid_options: rows:), the expanded card pops over the cards below it instead of pushing them down. For the push-down behavior in a sections view, set the card's grid options to size automatically (grid_options: rows: auto).
Add auto_expand: true to let the card manage itself: it expands automatically while any sensor reads out of range and collapses once readings have stayed normal for 5 minutes (the delay prevents flapping when a sensor hovers at a threshold). A manual tap takes over (the card stops auto-toggling until it is re-created, e.g. a page reload or dashboard edit), so the automation never fights you.
type: custom:air-quality-card
co2_entity: sensor.air_quality_co2
pm25_entity: sensor.air_quality_pm25
display: expandable
auto_expand: trueThe default thresholds follow WHO 2021 / ASHRAE / EPA guidelines, but you can override any of them. Provide an array of 4 ascending numbers — these become the 5-tier boundaries (Excellent / Good / Moderate / Elevated / Poor for most metrics; see Health Thresholds for the labels per metric).
type: custom:air-quality-card
temperature_entity: sensor.living_room_temp
temperature_unit: C
# In tropical climates, 26-29 °C is comfortable AC territory
temperature_thresholds: [22, 25, 28, 31]
# Stricter PM2.5 expectations than WHO 24h guideline
pm25_thresholds: [3, 8, 15, 25]
Notes:
- All custom thresholds are in the same unit as your sensor reports. For radon, the thresholds are always in Bq/m³ — the card converts your sensor value before comparison.
- Invalid thresholds (wrong length, non-numeric, etc.) silently fall back to the defaults. No errors thrown.
- Colors are not customizable — only the boundaries between them.
The card auto-detects your Home Assistant frontend language and translates the status badge, recommendations, recommendation subtitles, radon advisory titles, and editor labels. Translations included so far: English, Spanish, French, German, Portuguese, Hungarian, Polish (Spanish/French/German contributed by @b0rv3g4r4 on PR #11, Portuguese by @mzspicoli on PR #33, Hungarian by @fema3832 on PR #42, Polish by @diijkstra on PR #54).
If auto-detection picks the wrong language, force one explicitly with language: es (or en / fr / de / pt / hu / pl).
To contribute a new language: open a PR adding a block to the TRANSLATIONS const in air-quality-card.js. Copy the en: block, rename the key (e.g. it: for Italian), and translate the values — keep the structure identical. English is the fallback for any missing key.
Configure outdoor sensor entities to see a dashed comparison line on each graph showing outdoor conditions alongside indoor readings. When outdoor sensors are configured:
- A subtle dashed line appears on the corresponding graph
- Hovering shows both indoor and outdoor values
- Current outdoor values appear next to indoor readings
- Smart recommendations avoid suggesting ventilation when outdoor air is worse (e.g., "Keep Windows Closed" instead of "Open Window")
If you're using the card to monitor only outdoor air quality (e.g., a weather station or DIY ESPHome ambient sensor), you can configure just the outdoor_*_entity options. The card will:
- Render outdoor entities as primary graph lines
- Compute the status badge from the outdoor values using the same WHO thresholds
- Hide the recommendation strip — actions like "Open Window" or "Run Air Purifier" don't apply to ambient air
type: custom:air-quality-card
name: Outdoor Air Quality
outdoor_pm25_entity: sensor.outdoor_pm25
outdoor_pm10_entity: sensor.outdoor_pm10
outdoor_temperature_entity: sensor.outdoor_temperatureThe card automatically generates actionable recommendations based on your sensor readings -- no template sensors needed. It evaluates CO, Propane, O2, CO2, PM2.5, PM10, HCHO, NO2, O3, tVOC, and humidity levels, and when outdoor sensors are configured, it avoids suggesting ventilation when outdoor air is worse.
CO, Propane, and low-O2 safety alerts are always shown regardless of outdoor conditions -- carbon monoxide, a propane gas leak, and oxygen deficiency are all life-safety concerns. If any of them exceed dangerous levels, the card shows a critical red warning with instructions to leave the area.
Radon advisory banner appears as a separate element below the main recommendation when radon levels are elevated. Unlike other pollutants, radon changes over days/weeks and requires professional mitigation (not "open a window"), so it uses its own advisory system instead of the main recommendation waterfall. The advisory shows at three levels: informational (approaching action level), warning (above EPA action level of 4.0 pCi/L / 148 Bq/m3), and danger (significantly elevated, mitigation needed).
| Level | Range | Color | Meaning |
|---|---|---|---|
| Safe | < 4 ppm | Green | Normal background levels |
| Low | 4-9 ppm | Light Green | Acceptable for short exposure |
| Moderate | 9-35 ppm | Yellow | Improve ventilation |
| High | 35-100 ppm | Orange | Ventilate immediately |
| Dangerous | > 100 ppm | Red | Leave area immediately |
Based on EPA and WHO guidelines:
| Level | Range (pCi/L) | Range (Bq/m3) | Color | Meaning |
|---|---|---|---|---|
| Excellent | < 1.3 | < 48 | Green | Low risk |
| Good | 1.3-2.7 | 48-100 | Light Green | Below WHO reference level |
| Elevated | 2.7-4.0 | 100-148 | Yellow | Approaching EPA action level |
| High | 4.0-8.0 | 148-300 | Orange | Above EPA action level, consider mitigation |
| Dangerous | > 8.0 | > 300 | Red | Professional mitigation needed |
| Level | Range | Color | Meaning |
|---|---|---|---|
| Excellent | < 600 ppm | Green | Fresh outdoor air levels |
| Good | 600-800 ppm | Light Green | Well-ventilated space |
| Moderate | 800-1000 ppm | Yellow | Acceptable, consider ventilation |
| Elevated | 1000-1500 ppm | Orange | May affect concentration |
| Poor | > 1500 ppm | Red | Ventilation needed |
Based on WHO 2021 Air Quality Guidelines:
| Level | Range | Color | Meaning |
|---|---|---|---|
| Excellent | < 5 µg/m³ | Green | WHO annual guideline |
| Good | 5-15 µg/m³ | Light Green | WHO 24-hour guideline |
| Moderate | 15-25 µg/m³ | Yellow | Slightly elevated |
| Elevated | 25-35 µg/m³ | Orange | Consider air purifier |
| Poor | > 35 µg/m³ | Red | Air purifier recommended |
Based on WHO 2021 Air Quality Guidelines:
| Level | Range | Color | Meaning |
|---|---|---|---|
| Excellent | < 15 µg/m³ | Green | WHO annual guideline |
| Good | 15-45 µg/m³ | Light Green | Acceptable |
| Moderate | 45-75 µg/m³ | Yellow | Slightly elevated |
| Elevated | 75-150 µg/m³ | Orange | Consider air purifier |
| Poor | > 150 µg/m³ | Red | Air purifier recommended |
| Level | Range | Color | Meaning |
|---|---|---|---|
| Excellent | < 5 µg/m³ | Green | Clean air |
| Good | 5-15 µg/m³ | Light Green | Acceptable |
| Moderate | 15-25 µg/m³ | Yellow | Slightly elevated |
| Elevated | 25-35 µg/m³ | Orange | Consider air purifier |
| Poor | > 35 µg/m³ | Red | Air purifier recommended |
| Level | Range | Color | Meaning |
|---|---|---|---|
| Clean | < 500 p/0.1L | Green | Very clean air |
| Good | 500-1000 p/0.1L | Light Green | Normal levels |
| Moderate | 1000-3000 p/0.1L | Yellow | Slightly elevated |
| Elevated | 3000-5000 p/0.1L | Orange | Consider air purifier |
| Poor | > 5000 p/0.1L | Red | Air purifier recommended |
| Level | Range | Color | Meaning |
|---|---|---|---|
| Excellent | < 20 ppb | Green | Safe levels |
| Good | 20-50 ppb | Light Green | Acceptable |
| Moderate | 50-100 ppb | Yellow | Consider ventilation |
| Elevated | 100-200 ppb | Orange | Ventilation needed |
| Poor | > 200 ppb | Red | Take action |
The card auto-detects whether your sensor reports absolute concentration (ppb) or the unitless Sensirion VOC Index (0-500, centered at 100); force a mode with tvoc_unit if needed.
Absolute (ppb):
| Level | Range | Color | Meaning |
|---|---|---|---|
| Excellent | < 100 ppb | Green | Clean air |
| Good | 100-300 ppb | Light Green | Acceptable |
| Moderate | 300-500 ppb | Yellow | Consider ventilation |
| Elevated | 500-1000 ppb | Orange | Ventilation needed |
| Poor | > 1000 ppb | Red | Take action |
VOC Index (Sensirion):
| Level | Range | Color | Meaning |
|---|---|---|---|
| Excellent | < 100 | Green | Better than your home's average |
| Good | 100-150 | Light Green | Around average |
| Moderate | 150-250 | Yellow | Consider ventilation |
| Elevated | 250-400 | Orange | Ventilation needed |
| Poor | > 400 | Red | Take action |
Like tVOC, NOx comes in two flavors and the card auto-detects which one your sensor reports (force with nox_unit). Sensirion SGP41-based sensors (AirGradient ONE / Open Air, ESPHome sgp4x) report the unitless NOx Index — note its clean-air baseline is 1, not 100 like the VOC Index.
NOx Index (Sensirion) — bands follow Sensirion's integration guidance and AirGradient's dashboard:
| Level | Range | Color | Meaning |
|---|---|---|---|
| Excellent | < 5 | Green | Clean-air baseline (1) |
| Good | 5-20 | Light Green | Minor activity |
| Moderate | 20-150 | Yellow | NOx event — Sensirion's "trigger an air purifier" level |
| Elevated | 150-300 | Orange | Significant NOx event — ventilate |
| Poor | > 300 | Red | Major NOx event |
Absolute (ppb) — anchored to WHO 2021 / EPA NO₂ standards (applied to NOx conservatively). If your sensor reports µg/m³ instead of ppb, the card displays that unit but the default thresholds still assume ppb — set nox_thresholds in your sensor's unit (for NO₂, 1 ppb ≈ 1.88 µg/m³):
| Level | Range | Color | Meaning |
|---|---|---|---|
| Excellent | < 20 ppb | Green | ~WHO interim target 1 (40 µg/m³) |
| Good | 20-53 ppb | Light Green | Under the EPA annual NAAQS (53 ppb) |
| Moderate | 53-100 ppb | Yellow | Under the EPA 1-hour NAAQS (100 ppb) |
| Elevated | 100-360 ppb | Orange | EPA AQI Unhealthy-for-Sensitive-Groups range |
| Poor | > 360 ppb | Red | EPA AQI Unhealthy and above |
Assumes µg/m³ (this card's default gas unit). Anchored to WHO 2021 Air Quality Guidelines (annual/24h) and the EU Ambient Air Quality Directive (annual/hourly limits). If your sensor reports ppb, override no2_thresholds (1 ppb ≈ 1.88 µg/m³):
| Level | Range | Color | Meaning |
|---|---|---|---|
| Excellent | < 10 µg/m³ | Green | WHO 2021 annual guideline |
| Good | 10-25 µg/m³ | Light Green | Under WHO 2021 24-hour guideline |
| Moderate | 25-40 µg/m³ | Yellow | Under EU AQD annual limit |
| Elevated | 40-200 µg/m³ | Orange | Under EU AQD hourly limit |
| Poor | > 200 µg/m³ | Red | Exceeds EU AQD hourly limit — ventilation needed |
Assumes µg/m³. Anchored to WHO 2021 Air Quality Guidelines (peak-season/8h) and the EU Ambient Air Quality Directive (information/alert thresholds). If your sensor reports ppb, override o3_thresholds (1 ppb ≈ 2.00 µg/m³):
| Level | Range | Color | Meaning |
|---|---|---|---|
| Excellent | < 60 µg/m³ | Green | WHO 2021 peak-season guideline |
| Good | 60-100 µg/m³ | Light Green | Under WHO 2021 8-hour guideline |
| Moderate | 100-180 µg/m³ | Yellow | Elevated |
| Elevated | 180-240 µg/m³ | Orange | EU AQD information threshold |
| Poor | > 240 µg/m³ | Red | EU AQD alert threshold — ventilation needed |
There's no WHO/EPA ambient-O2 guideline, so this borrows OSHA's confined-space oxygen safety bands — a bell around the 20.9% ambient baseline, but safety-colored (red tails, not amber) since both oxygen-deficient and oxygen-enriched atmospheres are genuine hazards. Below 16% is treated as life-safety, same tier as CO (see below):
| Level | Range | Color | Meaning |
|---|---|---|---|
| Dangerous | < 16% | Red | OSHA dangerous impairment level — leave the area |
| Low | 16-19.5% | Orange | Below OSHA's oxygen-deficient threshold |
| Normal | 19.5-23.5% | Green | Typical ambient range |
| Enriched | 23.5-25% | Orange | Above OSHA's oxygen-enriched (fire risk) threshold |
| Dangerous | > 25% | Red | Significant fire hazard |
Not a WHO/EPA air-quality pollutant — it's a combustible-gas leak/explosion hazard, so it's treated as life-safety like CO rather than a ventilation-waterfall metric. Assumes raw %vol (not pre-scaled to %LEL). Propane's lower explosive limit (LEL) is 2.1%vol; bands anchor to 10%/20%/50% of that, the standard combustible-gas-detector alarm points (NFPA 715 / UL 2075 convention):
| Level | Range | Color | Meaning |
|---|---|---|---|
| Safe | < 0.05% | Green | Background levels |
| Low | 0.05-0.21% | Light Green | Acceptable |
| Moderate | 0.21-0.42% | Yellow | Gas Leak Warning — ventilate now |
| High | 0.42-1.05% | Orange | Gas Leak Danger — evacuate |
| Dangerous | > 1.05% | Red | Gas Leak Danger — evacuate immediately |
Anchored to WHO community noise guidance — 35 dB is the indoor living-area guideline, 55 dB the serious-annoyance level, and sustained exposure above 70 dB risks hearing damage. Above 70 dB the card recommends reducing the noise level:
| Level | Range | Color | Meaning |
|---|---|---|---|
| Quiet | < 35 dB | Green | WHO indoor living-area guideline |
| Moderate | 35-45 dB | Light Green | Typical occupied-home background |
| Elevated | 45-55 dB | Yellow | Noticeable, may disturb concentration/sleep |
| Loud | 55-70 dB | Orange | WHO serious-annoyance level |
| Very Loud | > 70 dB | Red | Prolonged exposure may harm hearing |
| Level | Range | Color | Meaning |
|---|---|---|---|
| Too Dry | < 30% | Orange | Use humidifier |
| Dry | 30-40% | Light Green | Acceptable |
| Comfortable | 40-50% | Green | Ideal range |
| Humid | 50-60% | Light Green | Acceptable |
| Too Humid | > 60% | Orange | Improve ventilation |
Informational, not a health hazard — a wide green band keeps typical weather calm. Thresholds assume hPa / mbar (what Airthings and most HA sensors report); override pressure_thresholds for other units.
| Level | Range (hPa) | Color | Meaning |
|---|---|---|---|
| Low | < 990 | Orange | Stormy / rapidly falling |
| Slightly Low | 990-1005 | Light Green | Below average |
| Normal | 1005-1025 | Green | Typical sea-level range |
| Slightly High | 1025-1040 | Light Green | Above average |
| High | > 1040 | Orange | Unusually high |
This card works with any sensor that provides entities for CO, Radon, CO2, PM2.5, PM10, PM4, PM1, PM0.3, HCHO, tVOC, NOx, O2, NO2, O3, Propane, humidity, temperature, atmospheric pressure, or noise. Use any combination -- even a single sensor works. Tested with:
- IKEA VINDSTYRKA / ALPSTUGA (via Matter)
- Aqara TVOC Air Quality Monitor
- Xiaomi Air Quality Monitor
- SenseAir S8
- AirGradient ONE / Open Air
- PurpleAir sensors
- Airthings Wave / Wave Plus (radon, CO2, tVOC, humidity, temperature)
- air-Q Science (CO2, PM, HCHO, tVOC, NOx, O2, NO2, O3, and the optional Propane sensor)
- Any ESPHome-based air quality sensor
# Clone the repository
git clone https://github.com/KadenThomp36/air-quality-card.git

# The card is vanilla JavaScript with no build step required
# Simply edit air-quality-card.js and test in Home Assistant

# Run tests
node test.jsContributions are welcome! Please feel free to submit a Pull Request.
MIT License - see LICENSE for details.
If you like this card, check out my other Home Assistant cards:
- Garage Card — A top-down visual garage card with door state, car presence, and light control
If you find this card useful, consider buying me a coffee!

- Thresholds based on WHO 2021 Air Quality Guidelines
- CO2 recommendations based on ASHRAE Standard 62.1
- CO thresholds based on EPA/WHO carbon monoxide guidelines