author: Jess Robertson (@jesserobertson)
The BoM, in it's wisdom, have made getting their geospatial data fairly difficult. This package aims to fix that
To see this readme as an ipython notebook, check out https://github.com/jesserobertson/bomber/blob/master/examples/request_bom_data.ipynb
Easiest way is using pip: pip install bomber. You'll need to have GDAL installed (Linux and Mac fellows can get it through homebrew/apt/yum/their package manager of choice, Windows peeps can find binaries online).
If you want to install by hand (using python setup.py install) you'll need rasterio, requests and numpy.
Check out the measurement/observation datasets that we have available:
>>> import bomber
>>> print(bomber.measurements.DATASETS)
{'ndvi': ['ndviave'],
'rainfall': ['totals'],
'solar': ['solarave'],
'temperature': ['maxave', 'minave'],
'vprp': ['vprp09', 'vprp15']}
Then we can get the bit that we want as a geotiff:
>>> geotiff = bomber.get_measurements(dataset='rainfall', year=2015, month=1)Downloaded data to rainfall_totals_month_2015010120150131.geotiff
and then plot it using rasterio
>>> import rasterio, numpy
>>> import matplotlib.pyplot as plt
>>> with rasterio.drivers():
...     with rasterio.open(geotiff) as src:
...         fig = plt.figure(figsize=(11, 11))
...         data = numpy.ma.MaskedArray(
...             data=src.read(1),
...             mask=src.read_masks(1))
...         ax = fig.gca()
...         ax.imshow(data, cmap=plt.get_cmap('coolwarm'))
...         ax.set_aspect('equal')
...         ax.set_axis_off()
...         ax.set_title('Rainfall, January 2015')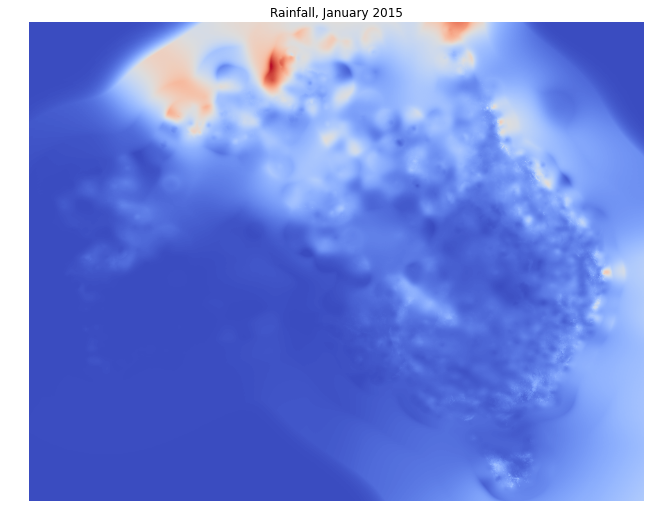
You can also get the climatic average datasets as well:
>>> print(bomber.climate.DATASETS){'decadal-rainfall': ['r'], 'decadal-temperature': ['mx', 'mn']}
There's also a borked version for the climate regions but I'm too lazy to finish that one. Pull requests welcome!