
![]()
⚠️ Not affiliated with Tibber This is an independent, community-maintained custom integration for Home Assistant. It is not an official Tibber product and is not affiliated with or endorsed by Tibber AS.
The most comprehensive Tibber price integration for Home Assistant. Get 100+ sensors with quarter-hourly precision, intelligent best/peak price period detection, price forecasts, trend analysis, volatility tracking, and beautiful chart visualizations - all from a single integration. Automate your energy consumption like a pro.
📚 Complete Documentation — Installation, guides, examples, and full sensor reference:
- 👤 User Documentation — Setup, sensors, automations, dashboards
- 🔧 Developer Documentation — Architecture, contributing, development
Quick Links: Installation · Sensor Reference · Charts · Automations · FAQ · Changelog
Most Tibber integrations give you a single price sensor. This one gives you a complete energy optimization toolkit:
- Quarter-hourly precision — 15-minute interval prices, not just hourly averages
- Price forecasts — See average prices for the next 1h, 2h, 3h, ... up to 12h ahead
- Trend analysis — Know if prices are rising, falling, or stable — and when the next trend change happens
- Price trajectory — Detect turning points before they happen (first-half vs second-half window comparison)
- Price outlook — Instantly see if the next hours will be cheaper or more expensive than now
- Best Price & Peak Price Periods — Intelligent binary sensors that detect the cheapest and most expensive periods of the day, with configurable flexibility, relaxation strategies, and gap tolerance (how it works)
- Period timing sensors — Duration, end time, remaining minutes, progress percentage, and countdown to next period — everything you need for advanced automations
- Runtime configuration — Adjust period detection parameters on the fly via switches and number entities, without restarting — perfect for automations that adapt to your schedule
- 5-level price classification — VERY_CHEAP, CHEAP, NORMAL, EXPENSIVE, VERY_EXPENSIVE from Tibber's API
- 3-level price ratings — LOW, NORMAL, HIGH based on 24h trailing average comparison
- Auto-generated ApexCharts — One action call generates a complete chart configuration with dynamic Y-axis scaling and color-coded price levels (see examples)
- Dynamic icons & colors — Every sensor adapts its icon and color to the current price state — cheap prices glow green, expensive ones turn red (icon guide)
- Chart data export — Flexible data API with filtering, resolution control, and multiple output formats for any visualization card
- Volatility analysis — Know if today's prices are stable or wild (low/moderate/high/very_high)
- Daily & rolling statistics — Min, max, average, median for today, tomorrow, trailing 24h, and leading 24h
- Energy & tax breakdown — See spot price vs. tax components as sensor attributes
- Multi-currency support — EUR, NOK, SEK, DKK, USD, GBP with configurable base/subunit display (€ vs ct, kr vs øre)
- Intelligent caching — Multi-layer caching minimizes API calls, survives HA restarts, auto-invalidates at midnight
- High-performance interval pool — O(1) timestamp lookups, gap detection, auto-fetching of missing data
- Quarter-hour precision updates — Sensors refresh at :00/:15/:30/:45 boundaries, independent of API polling
- Official API only — Uses Tibber's
priceInfoandpriceInfoRangeendpoints. All ratings and statistics are calculated locally.
Prerequisites: HACS (Home Assistant Community Store) must be installed.

- Click "Download" to install
- Restart Home Assistant

- Enter your Tibber API token (get one here)
- Select your Tibber home
- Configure price thresholds (optional — sensible defaults are provided)
Or manually: Settings → Devices & Services → + Add Integration → search "Tibber Price Information & Ratings"
- 100+ sensors are now available (key sensors enabled by default, advanced ones ready to enable)
- Explore entities in Settings → Devices & Services → Tibber Price Information & Ratings
- Start building automations, dashboards, and energy-saving workflows
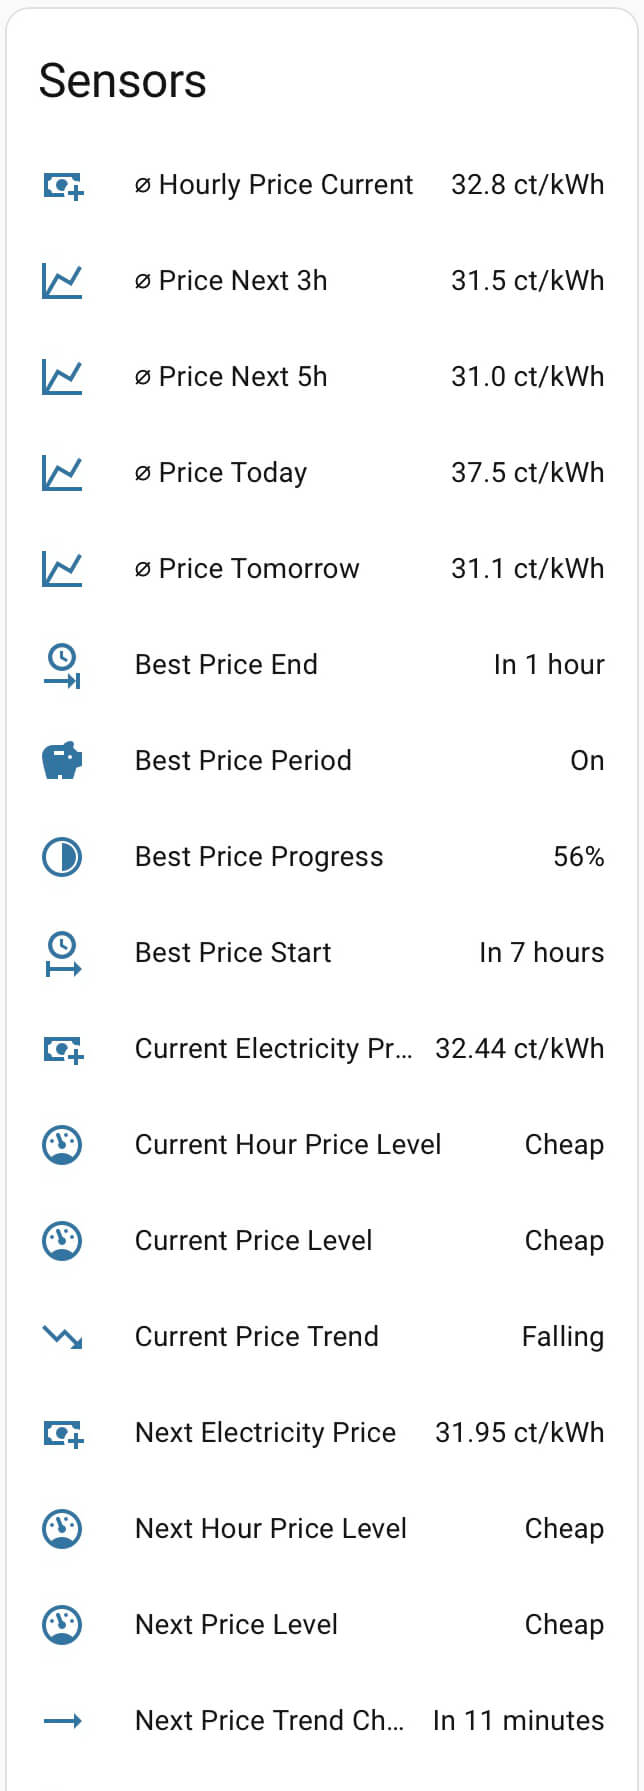
The integration provides 100+ entities across sensors, binary sensors, switches, and number entities. Here are the highlights — all key sensors are enabled by default:
| Category | Highlights | Count |
|---|---|---|
| 💰 Prices | Current, next & previous interval price + rolling hour averages | 6+ |
| 📊 Statistics | Daily min/max/avg for today & tomorrow, 24h trailing & leading windows | 12+ |
| 🔮 Forecasts | Next 1h–12h average prices, price outlook & trajectory sensors | 20+ |
| 📈 Trends | Current trend direction, next trend change time & countdown | 3 |
| 📉 Volatility | Today, tomorrow, next 24h & combined volatility levels | 4 |
| 🏷️ Levels & Ratings | 5-level (API) and 3-level (computed) classification per interval, hour & day | 12+ |
| ⏰ Period Timing | Best/peak: end time, duration, remaining, progress, next start | 10+ |
| 🔌 Binary Sensors | Best price period, peak price period, tomorrow data available, API connection | 4+ |
| 🎛️ Runtime Config | Switches & numbers to adjust period detection live — no restart needed | 14 |
| 🔧 Diagnostics | Data lifecycle status, home metadata, grid info, subscription status | 15+ |
Every sensor includes rich attributes — timestamps, detailed descriptions, and context data. Enable Extended Descriptions in the integration options to get
long_descriptionandusage_tipson every entity.
📖 Complete Sensor Reference → — All entities with descriptions, attributes, and multi-language lookup
See the full automation examples guide for more recipes.
Run appliances when electricity is cheapest:
automation:
    - alias: "Start Dishwasher During Best Price Period"
      trigger:
          - platform: state
            entity_id: binary_sensor.tibber_best_price_period
            to: "on"
      action:
          - action: switch.turn_on
            target:
                entity_id: switch.dishwasher
Reduce heating when prices spike above average:
automation:
    - alias: "Reduce Heating During High Prices"
      trigger:
          - platform: numeric_state
            entity_id: sensor.tibber_current_interval_price_rating
            above: 20 # More than 20% above 24h average
      action:
          - action: climate.set_temperature
            target:
                entity_id: climate.living_room
            data:
                temperature: 19
📖 More automations → — EV charging, heat pump control, price notifications, and more
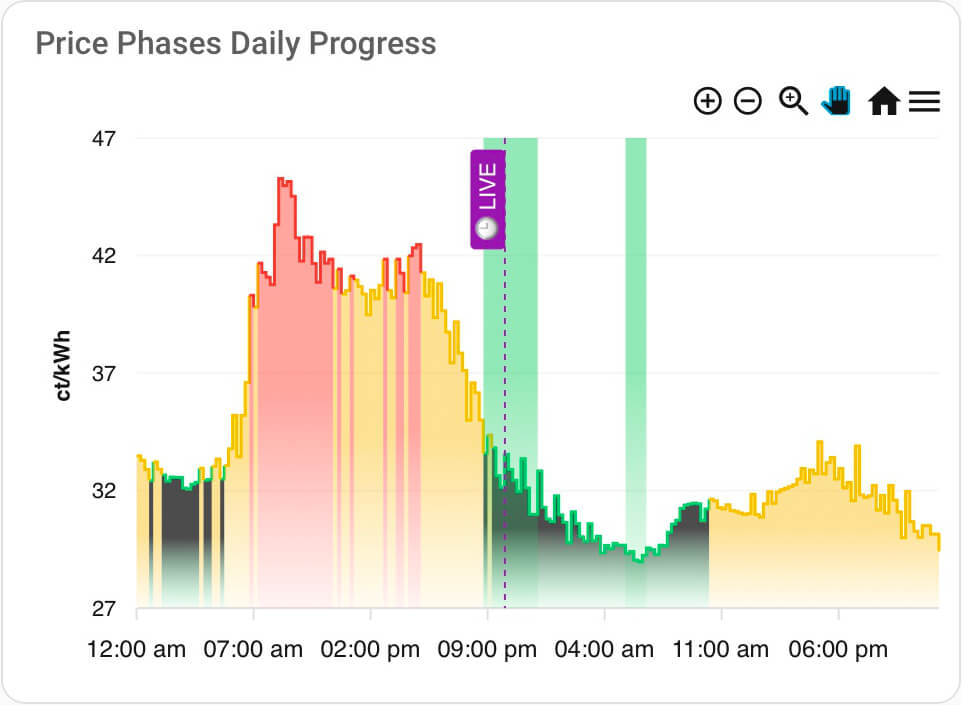
Generate beautiful price charts with a single action call — dynamic Y-axis, color-coded price levels, and multiple chart modes included.
📖 Chart examples & setup → | Actions reference →
- 📖 FAQ — Common questions answered
- 🔧 Troubleshooting — Solving common issues
- 🐛 Report an Issue — Found a bug? Let us know
Contributions are welcome! See the Contributing Guidelines and Developer Documentation to get started.
- Developer Setup — DevContainer-based development environment
- Architecture Guide — Understand the codebase
- Release Management — Release process and versioning
This integration is developed with extensive AI assistance (GitHub Copilot, Claude, and other AI tools). While AI enables rapid development, it's possible that some edge cases haven't been discovered yet. If you encounter any issues, please open an issue — we'll fix them (with AI help, of course! 😊).
Quality is ensured through automated linting (Ruff), static type checking (Pyright), and real-world testing.
This project is licensed under the MIT License — see the LICENSE file for details.