Welcome to the Rainwater Harvesting Simulation Dashboard, a real-time full-stack MERN application that visualizes the operational lifecycle of a rainwater collection system. It simulates sensor readings, computes energy conversion metrics, and displays live updates on an interactive dashboard every 5 seconds.
- 📊 Live Dashboard: https://pandarainwaterharvesting.vercel.app/
- 🌐 Frontend: https://github.com/subramanyamchoda/rainwaterharvesting_client
- 💪 Backend: https://github.com/subramanyamchoda/rainwaterharvesting_server
- ⏰ Simulates data every 5 seconds for real-time display
- 🌧️ Tracks tank water level, flow rate, turbine RPM, power output, and battery storage
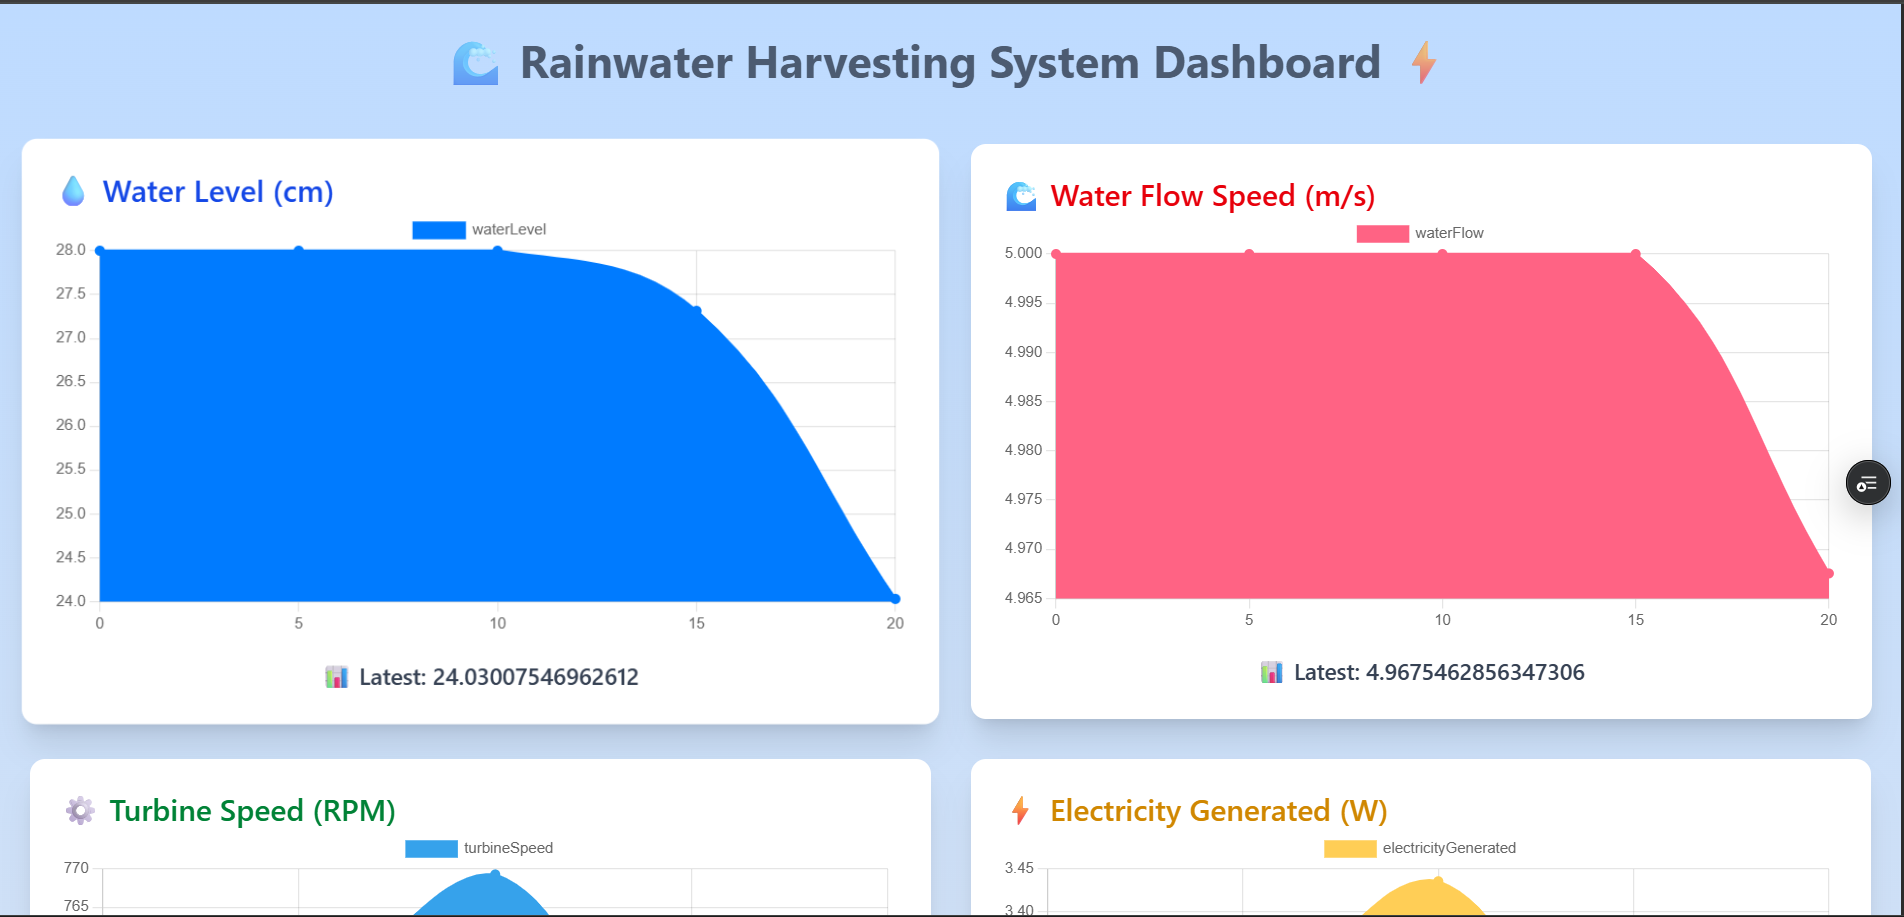
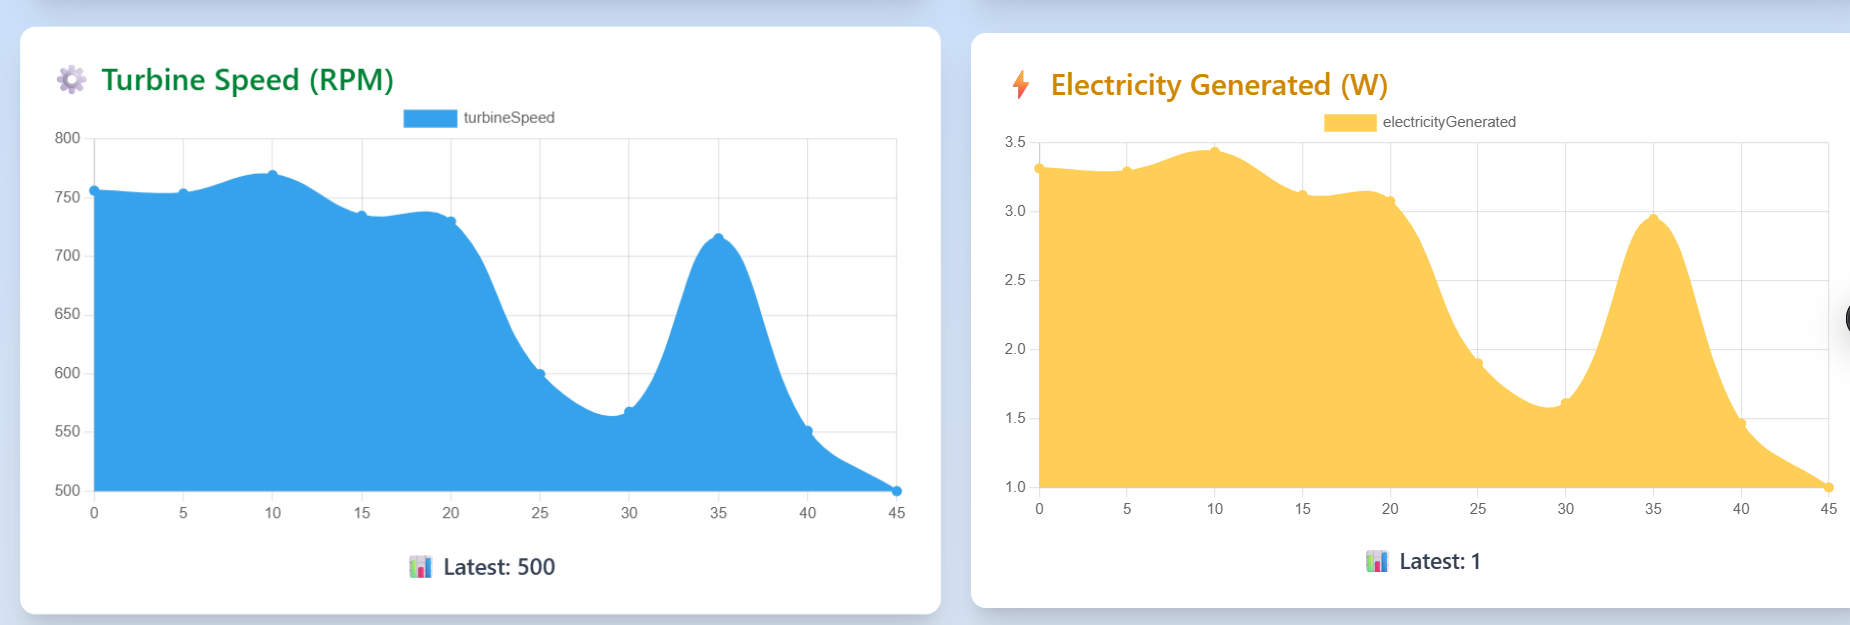
- 📈 Displays 6 real-time charts using Chart.js
- 🚀 Live updates via WebSockets (Socket.IO)
- 🏐 Fully responsive and animated UI
| Chart | Description |
|---|---|
| 🚰 Tank Level | Simulated water volume in the reservoir |
| 🌊 Flow Rate | Calculated flow based on current tank level |
| ⚙️ Turbine RPM | Derived from flow; max 1500 RPM |
| ⚡ Electricity Generated | Power output from turbine RPM |
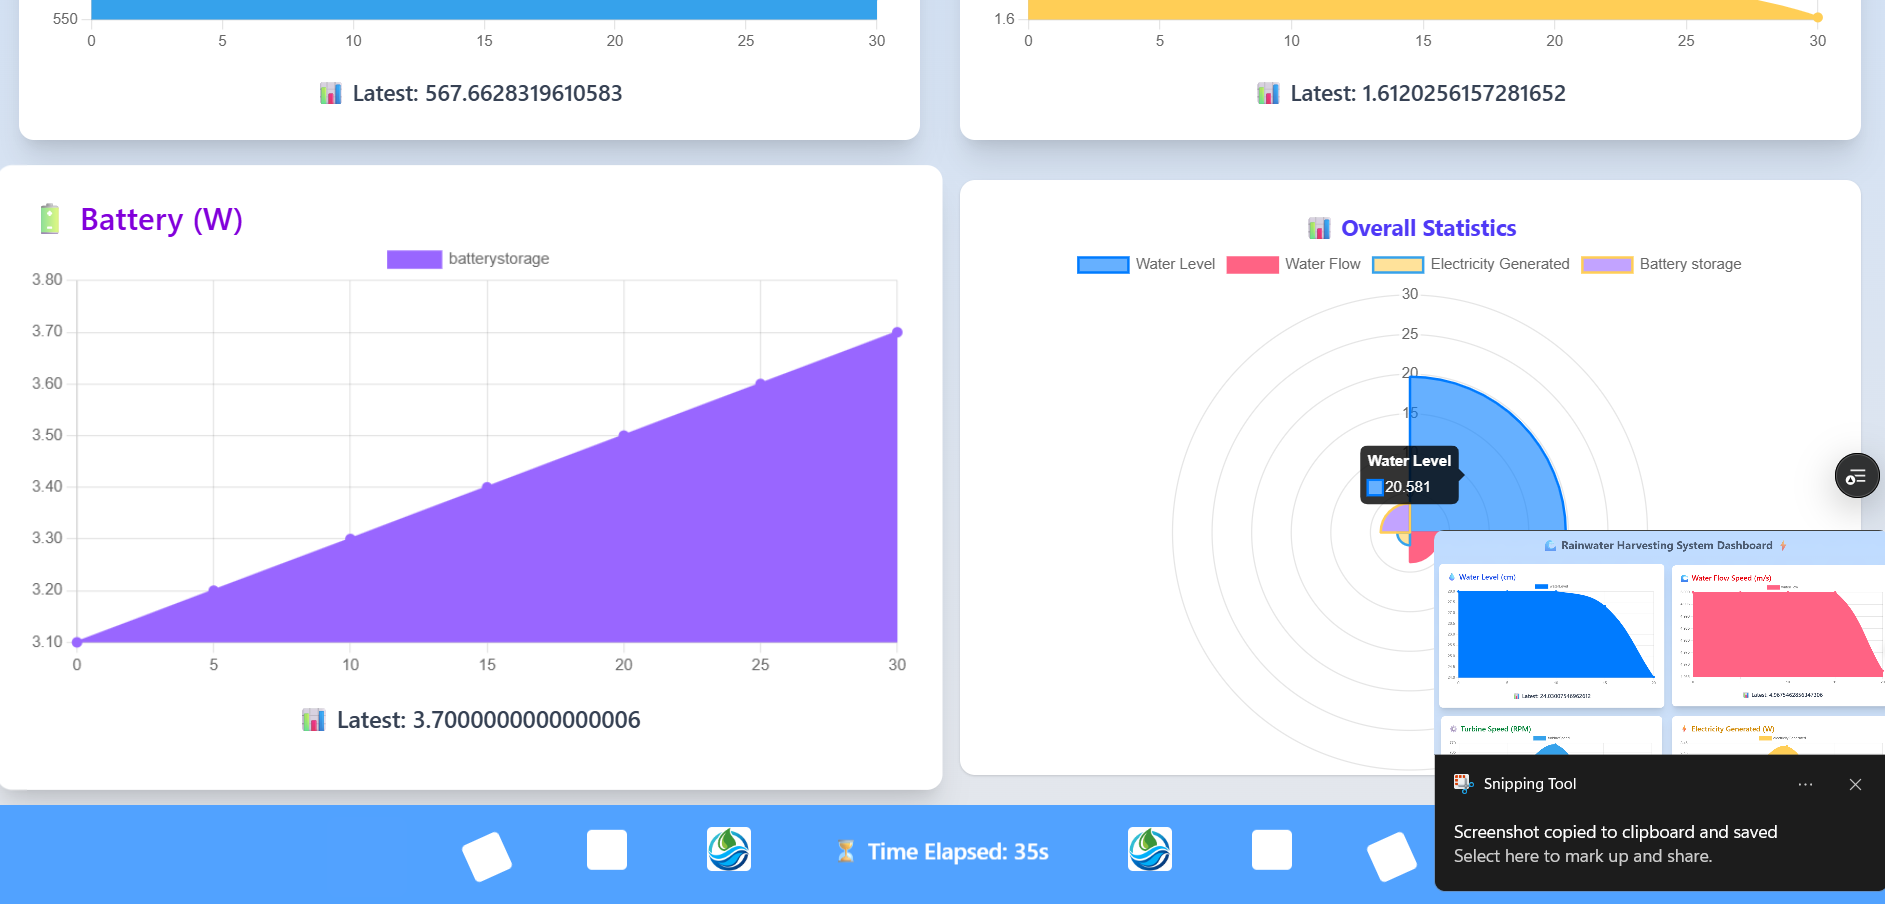
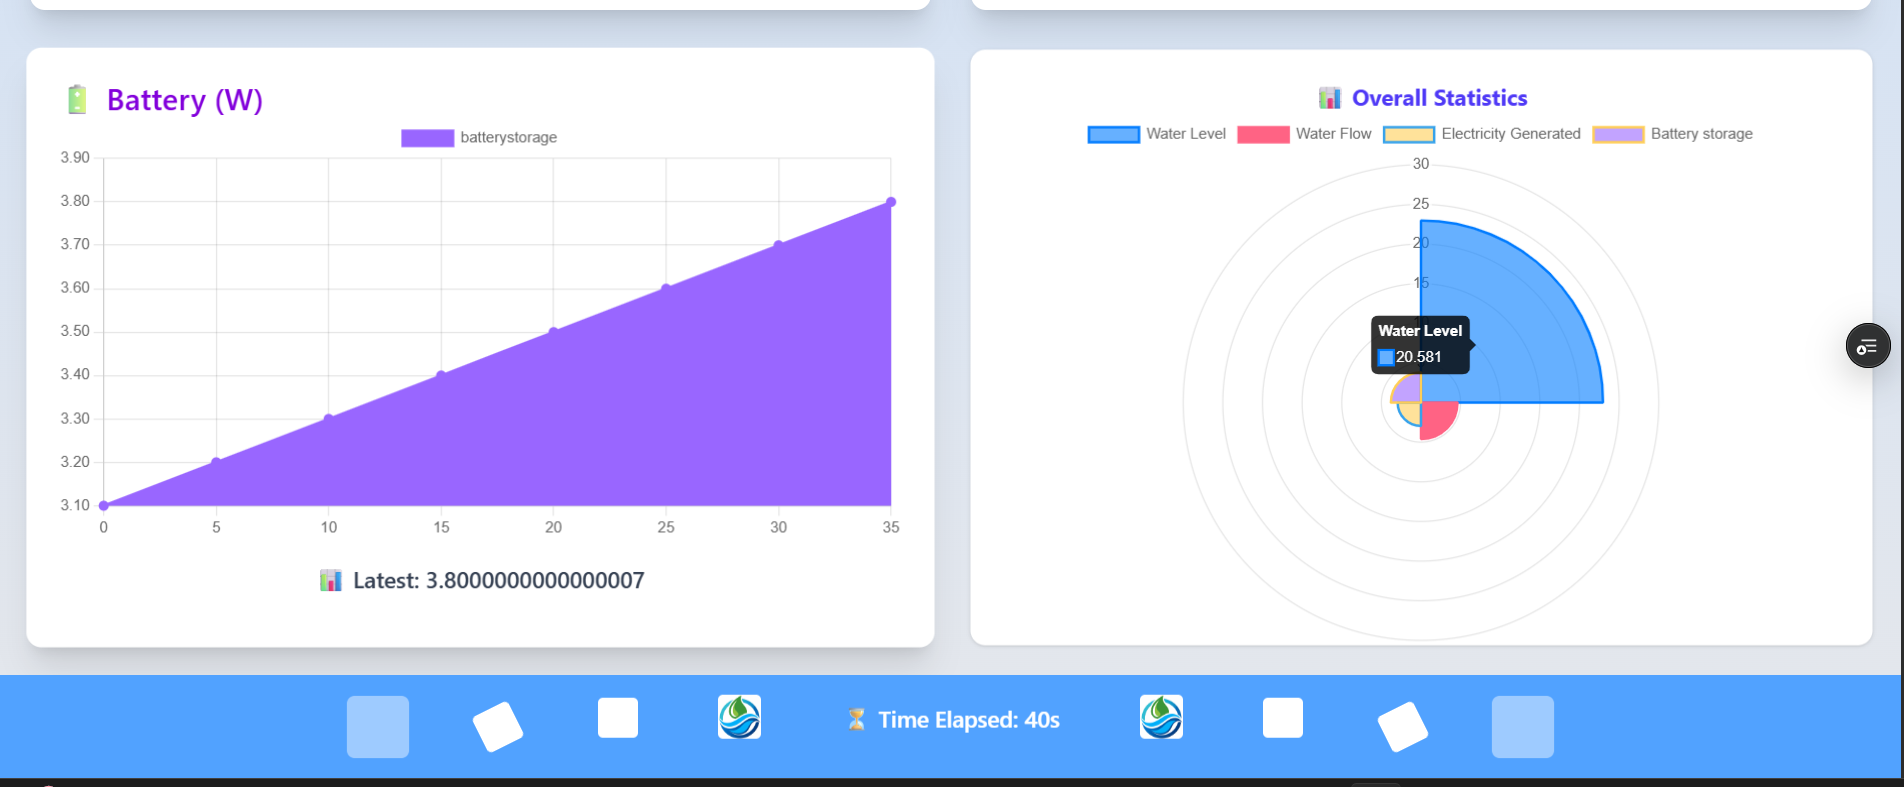
| 🔋 Battery Storage | Cumulative energy stored |
| 🧱 System Overview | Polar chart showing overall system health |
Simulated water tank receives rainwater. Tank level is updated every 5 seconds.
Water flow rate is proportional to tank water level:
- Higher tank level = faster flow
- Lower tank level = slower flow
The flow drives a simulated turbine:
- Faster water flow = higher RPM (capped at 1500)
Turbine rotation is converted to electrical energy:
- More RPM = higher power output
Generated electricity is added to a battery model over time.
| Layer | Technology |
|---|---|
| Frontend | React.js + Tailwind CSS + Chart.js |
| Backend | Node.js + Express |
| Real-time | Socket.IO |
| Database | MongoDB Atlas |
| Deployment | Vercel (Frontend) + Render (Backend) |
# Frontend
git clone https://github.com/subramanyamchoda/rainwaterharvesting_client.git
cd rainwaterharvesting_client
npm install

# Backend
git clone https://github.com/subramanyamchoda/rainwaterharvesting_server.git
cd rainwaterharvesting_server
npm installPORT=5000
MONGODB_URI=your-mongodb-uriVITE_API_BASE_URL=http://localhost:5000🔒 Replace
your-mongodb-uriwith your MongoDB Atlas URI.
# Start backend
npm run dev

# In separate terminal for frontend
npm run dev
Visit: http://localhost:5173
We welcome community contributions!
# Fork the repository
# Create your branch
git checkout -b feature/YourFeature
# Commit changes
git commit -m "Add YourFeature"
# Push to GitHub
git push origin feature/YourFeature
# Open a Pull Request 🎉This project was created for practical experience in:
- Real-time system simulation
- WebSocket communication
- Dynamic environmental data visualization
- Full-stack MERN architecture
- Responsive, animated dashboard interfaces
- 📊 Live Dashboard
- 👁🗨️ Demo Video Available in Repo
Thanks for exploring the Rainwater Harvesting Dashboard! Feel free to ⭐ the repo or connect on LinkedIn 🌱