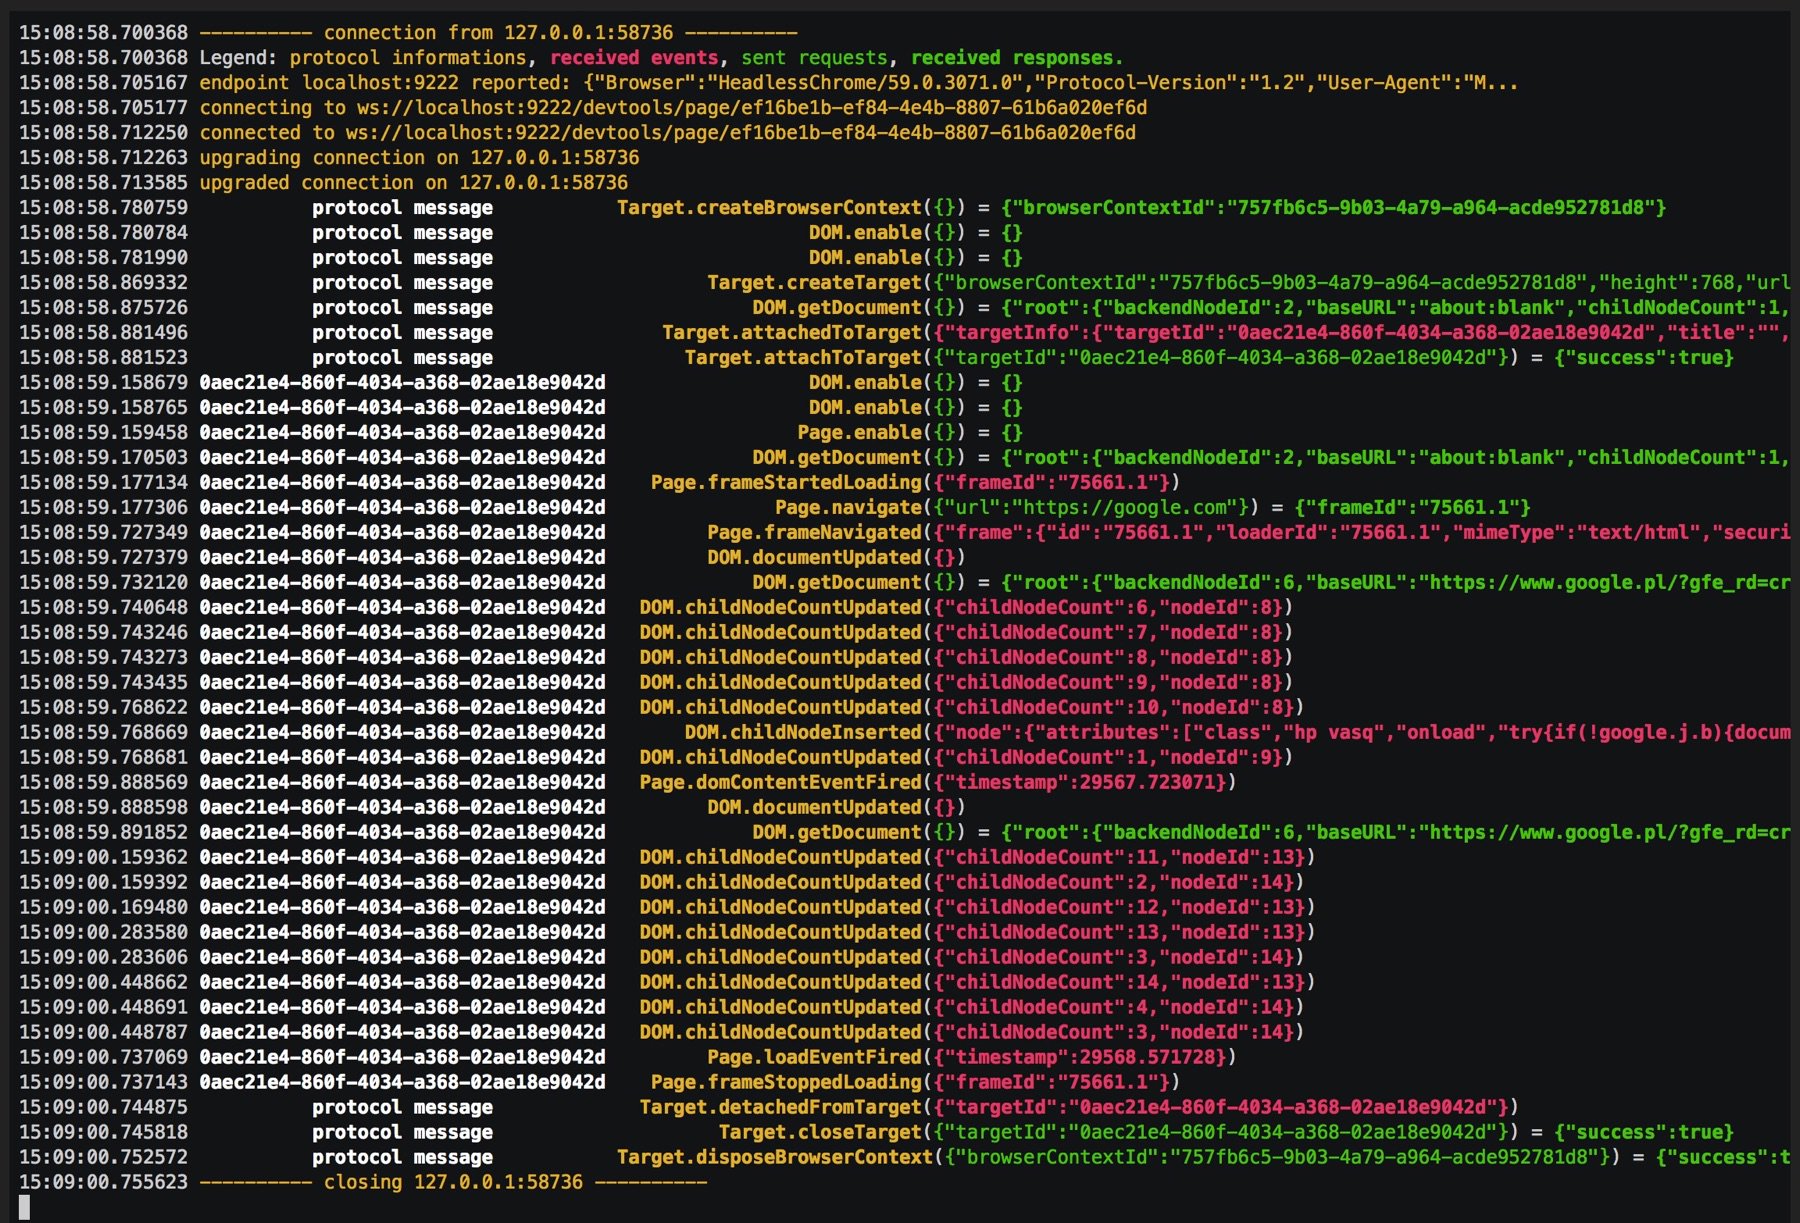
chrome-protocol-proxy is small, reverse proxy designed for working with Chrome's DevTools protocol. It captures all commands sent to and events received from Chrome, coalesce requests with responses, unpack messages from Target domain and provide easy to read, colored output. This tool is a fork of (and heavily inspired by) chromedp-proxy.
brew install --cask wendigo/tap/chrome-protocol-proxy
Since v0.7.1 the tap ships a cask instead of a formula. If you installed an older version (≤ 0.6.0) via brew install wendigo/tap/chrome-protocol-proxy, the old formula keg will keep shadowing the cask binary and brew upgrade won't pick up new versions. Migrate once with:
brew update
brew uninstall --formula chrome-protocol-proxy
brew install --cask wendigo/tap/chrome-protocol-proxy
scoop bucket add wendigo https://github.com/wendigo/scoop-bucket
scoop install chrome-protocol-proxy
go install github.com/wendigo/chrome-protocol-proxy@latest
docker run -t -i -p 9222:9222 wendigo/chrome-protocol-proxy:latest
This image bundles headless Chrome in the latest version so debugger is ready to use (head to http://localhost:9222 to validate).
Prebuilt binaries for Linux, macOS and Windows (amd64, arm and arm64) are available on the releases page.
- colored output,
- protocol frames filtering,🖖
- interactive web UI with live frame streaming, searching, filtering and command sending (see below),
- request-response coalescing,
- interprets Target.sendMessageToTarget requests,
- interprets Target.receivedMessageFromTarget responses and events with sessionId,
- understands flatted sessions (crbug.com/991325)
- calculates and displays time delta between consecutive frames,
- writes logs and splits them based on connection id and target/session id.
-d	write logs file per targetId
-delta
   show delta time between log entries
-exclude value
   exclude requests/responses/events matching pattern (default exclude = )
-force-color
   force color output regardless of TTY
-i	include request frames as they are sent
-include value
   display only requests/responses/events matching pattern (default include = )
-l string
   listen address (default "localhost:9223")
-log-dir string
   logs directory (default "logs")
-m	display time in microseconds
-once
   debug single session
-q	do not show logs on stdout
-r string
   remote address (default "localhost:9222")
-s max_length
   shorten requests and responses to max_length
-ui
   serve interactive UI on /ui (default true)
-version
   display version information
While the proxy is running, an interactive UI is available on http://localhost:9223/ui (disable with -ui=false). It streams all captured protocol frames live and allows to:
- search frames and filter them by pattern (include/exclude) and by type (requests, responses, events),
- see requests coalesced with their responses in a single row, with per-command latency,
- pause, resume and clear the captured stream, inspect any frame as pretty-printed JSON,
- send DevTools protocol commands to any active connection (optionally within a session), including replaying captured requests.
Commands sent from the UI use a reserved id range (starting at 1000000000) so their responses are intercepted by the proxy and shown only in the UI — the proxied client never sees them.
